The UK political scene is more than a two-party duopoly. At any given election there are many dozens of parties standing across the country. Though some of these are sui generis, the majority can be categorised into ideological groups. There are already easy-to-find charts plotting the individual parties' results, but I decided that it would be interesting to aggregate these groups and track them over time, especially for the smaller ideological groupings.
The ideological groupings
For this exercise I have considered nine main groupings. Note that while these groupings may have some relevance to other countries, they are defined in UK terms as being of relevance to UK politics. I may have missed, or not recognised, some obscure parties, but this ought to not make much difference to the totals, especially for the larger groupings.
- Labourist
- Almost exclusively the Labour Party; beyond that, other similarly centre-left workerist groups, especially disgruntled spin-offs of the Labour Party.
- Conservative
- Almost exclusively the Conservative Party; beyond that, other similarly centre-right conservative groups, especially loosely affiliated parties of the Conservative Party.
- Liberal etc.
- Mostly the succession of the old Liberal Party, the brief SDP–Liberal Alliance, and the Liberal Democrats; beyond that, other similarly centrist liberal groups, especially spin-offs of the various Liberal Parties, and groups that went on to join them.
- Green
- Mostly the Green Party of England and Wales¹ (and its predecessor, the Ecology Party), along with its Celtic sister parties; beyond that, other environmental and animal rights single-issue parties. The first entry is the pacifist environmentalist Fellowship Party in 1959.
- Nationalist / Regionalist
- A large group of parties agitating for increased autonomy and benefits (up to and including full independence) for a “national” or other regional sub-division of the UK. Most of this is the three main nationalist parties: the Scottish National Party (SNP) [Scotland]; Plaid Cymru [Wales, “Party of Wales”]; and Sinn Féin [(Northern) Ireland, “We Ourselves”], and these are among the first entries for their respective branches, with Sinn Féin alongside the Nationalist Party. Beyond that, there are other sectarian nationalist groupuscules, and parochial regional identity parties such as the Yorkshire Party. The first regionalist entry is the Vectis National Party for the Isle of Wight in 1970.
- Unionist
- The opposite of the nationalist / regionalist parties in a way, parties that exist to support the Union, primarily in Northern Ireland. Most of this is the two main Northern Irish Unionist parties, the Ulster Unionist Party and the Democratic Unionist Party; beyond that, there are various sectarian Northern Irish groupuscules. The first entry is the Commonwealth Labour Party in 1945; until the 1970s, Northern Irish Unionists voted for the Conservative Party.
- Populist
- These are parties that are not merely staidly conservative, but which are also not full-blown fascist parties. The archetype is the Faragist UKIP–Brexit Party–Reform UK succession; beyond that there are dozens of obscure groups, most notably the English Democrats, Sir James Goldsmith's Referendum Party, and the Christian and Christian Peoples Parties. The first entry is the Liverpool Protestant Party in 1931.
- Fascist
- In terms of votes, almost entirely the British National Party (BNP), with most of the rest made up of the National Front; the remainder are a handful of eccentric fascist sects. The first entry is Oswald Mosley's New Party in 1931, later the British Union of Fascists.
- Hard Left
- Groups adhering to some form of socialism or communism as commonly understood, not including national socialists, be they fascist (e.g. BNP) or independence movements (e.g. SNP). This is the largest grouping, and the one least dominated by a single organisation, indicative of how schismatic the hard left is. The main entry, with about half of the votes, mostly due to its unique longevity, is the Communist Party of Great Britain (CPGB). The first entries, alongside CPGB, are an Independent Communist and, ironically, the Anti-Parliamentary Communist Federation in 1922. The most recent entry to get over a quarter of one percent of the vote is the Respect Party in 2005.
- Other
- Various groups, mostly independents, with some eccentrics thrown in. How to categorise the Natural Law Party, or the Monster Raving Loony Party? Whereof I cannot speak, thereof I must be silent.
The elections
I included all nationwide UK elections from 1922–2019, i.e. both general elections and European elections. I have only covered nationwide elections because it is easy to find comprehensive but manageable data for these, and to make that data consistent across iterations. The local election data is enormous by comparison, local boundaries shift constantly, and the areas electing are inconsistent every year: if Rallings and Thrasher have to put in so much work to figure all that out and it's their day job, I'm not going to start there! I have included European elections in the dataset because I started keeping the file before the Brexit referendum, and then I figured I may as well input the last election in 2019 for completeness' sake. More generally, although European elections are sometimes used for “protest” votes, their proportional representation methodology means they are perhaps a better indicator of voters' ideological views unconstrained by FPTP.
The terminal cut-off is 2019 because at time of writing in 2021, that was the last year in which there were national elections.² The starting date is the first nationwide UK election that I consider sufficiently consistent with the subsequent series. Before 1918's Representation of the People and Parliament (Qualification of Women) Acts, the system was all but unrecognisable from today. As for the 1918 UK general election itself, it was the last to include the whole island of Ireland before their violent insurrection, distorting the figures. 1918 was the “coupon election”, making it unclear where to assign the Coalition Liberals; by 1922 the situation had stabilised sufficiently. There is some cause to place the cut-off after the Representation of the people Act 1948, which abolished plural voting, especially the university constituencies. However, this does not seem to have significantly affected the broad thrust of ideological groupings in Parliament, as it only affected a small number of voters and constituencies directly, not enough to overwhelm the mass voting behaviour of the electorate newly enfranchised in 1918. 1922 is thus selected, as the first election after the 1918 reforms and the loss of Ireland.
When graphing, I have treated each election year as an integer, except where two nationwide elections occurred in the same year, in which case the second election is plotted as “x.5”. So, for example, the 2019 European election is plotted as 2019, and the 2019 general election is plotted as 2019.5. This is to allow the results to be plotted on a single graph if required. Using precise dates rather than integer years would not produce a visible difference on a chart. The Other total for some elections was sometimes difficult to find or define accurately, as for convenience I used Wikipedia as my data source, which is not always consistent. Therefore the absolute percentages may be slightly off for some elections, though the relative proportions should be fairly stable.
The results
Averaged across time, the figures for each grouping are as follows:
| Ideology | All (1922–2019) |
General (1922–2019) |
European (1979–2019) |
|---|---|---|---|
| Labourist | 35.88% | 38.31% | 28.56% |
| Conservative | 39.05% | 42.18% | 29.67% |
| Liberal etc | 14.61% | 14.75% | 14.19% |
| Green | 2.83% | 0.76% | 6.52% |
| Nats / Regns | 2.45% | 1.93% | 4.01% |
| Unionist | 1.32% | 1.10% | 1.98% |
| Populist | 6.49% | 1.94% | 15.58% |
| Fascist | 0.72% | 0.25% | 2.18% |
| Hard Left | 0.35% | 0.24% | 0.72% |
| Other | 0.47% | 0.34% | 0.85% |
This table immediately suggests that our intuition about European elections being a better marker of ideological preference was probably true, as all of the non-mainstream ideological groupings performed better in European elections, despite the expense of standing in them. This holds true even if we account for European elections being more recent, when non-mainstream ideological voting has increased: even looking only at general elections from 1979–2019, each of the smaller groupings performed better in European elections than in general elections. This effect is strongest for the Greens and the Populists.
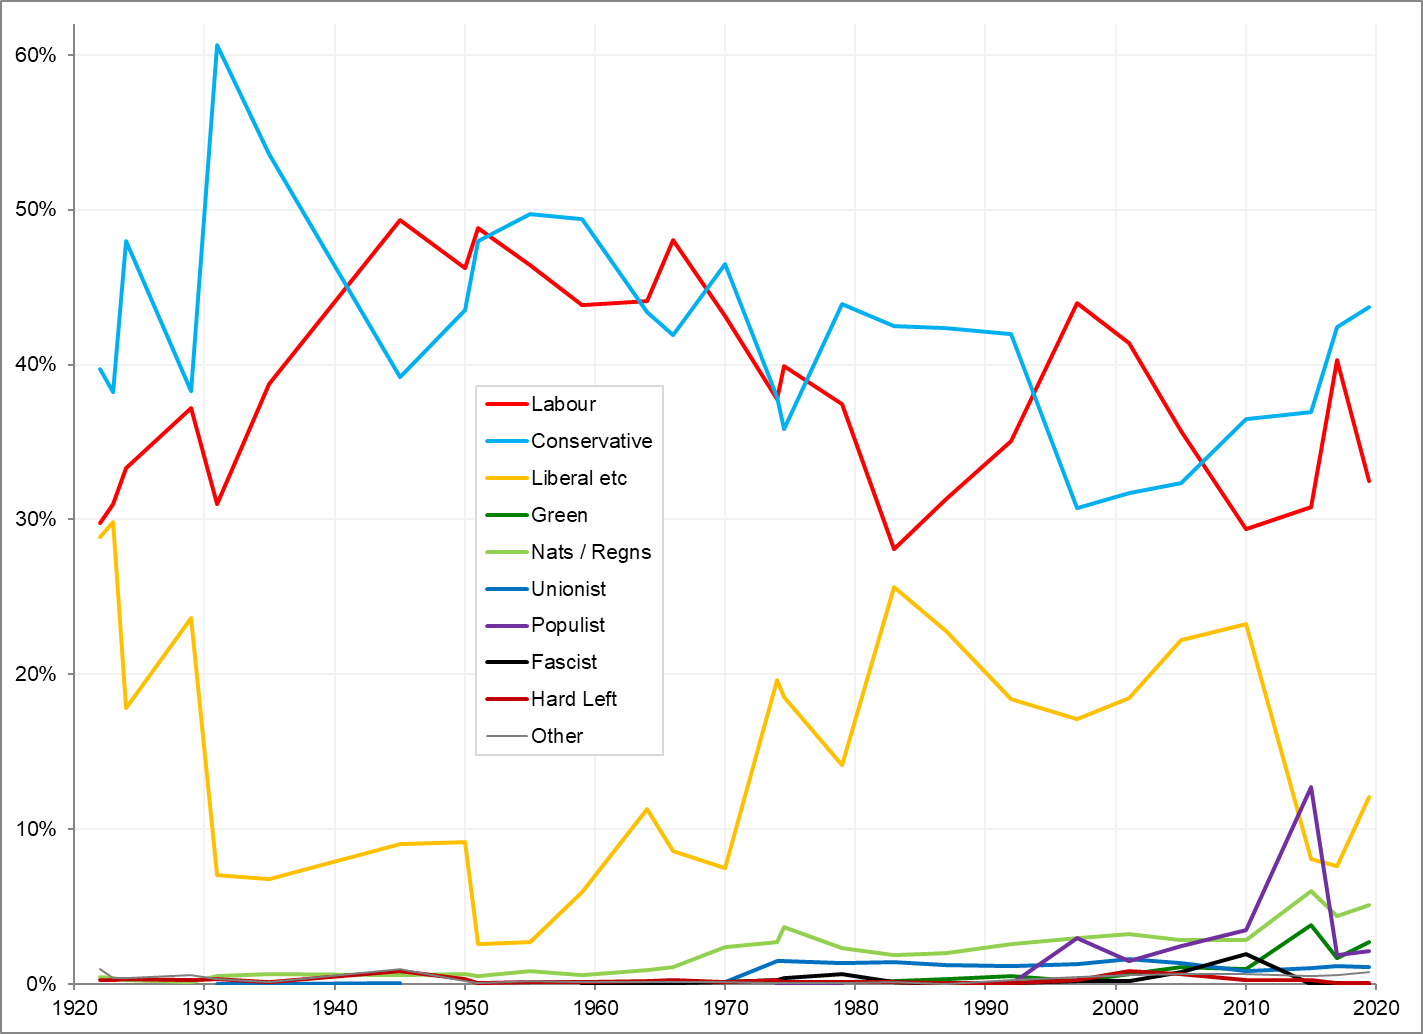
This chart is best-suited to showing the “push-comes-to-shove” choices forced by FPTP for the three major ideological groupings of Labourist, Conservative, and Liberal. The inverse relationship between the Labourist and Liberal vote shares is clear to see, and indeed the Labourist and Liberal vote shares have a correlation of -0.650. Not so clear to the eye is that the Conservative and Liberal vote shares have an almost equally strong negative correlation, of -0.570. Meanwhile there is almost no relationship between Labourist and Conservative vote shares, a correlation of just +0.051, and the minor groupings correlate strongly with each other (e.g., Green to Nats / Regns +0.852, Greens to Populists +0.818). This suggests that the primary ideological dynamic of the past century in British politics has not been the Labour-Conservative shadowplay, but the struggle between the two establishment parties and the rest.
The trendlines of the three main parties mirror each other with two matching inflection points. (An x³ trendline produces the best fit, with much more variance explained than the x² trendline, but not much less than the x⁴ trendline. The x³ trendlines have R² of: Liberals 70%; Labourist 57%, Conservative 42%.) The first inflection point occurs around 1950, the Liberal nadir and the peak of two-party politics. The second inflection point occurs around 2000, in the Liberal plateau following their post-SDP Alliance resurgence of 1983, but before their post-Coalition collapse of 2015.
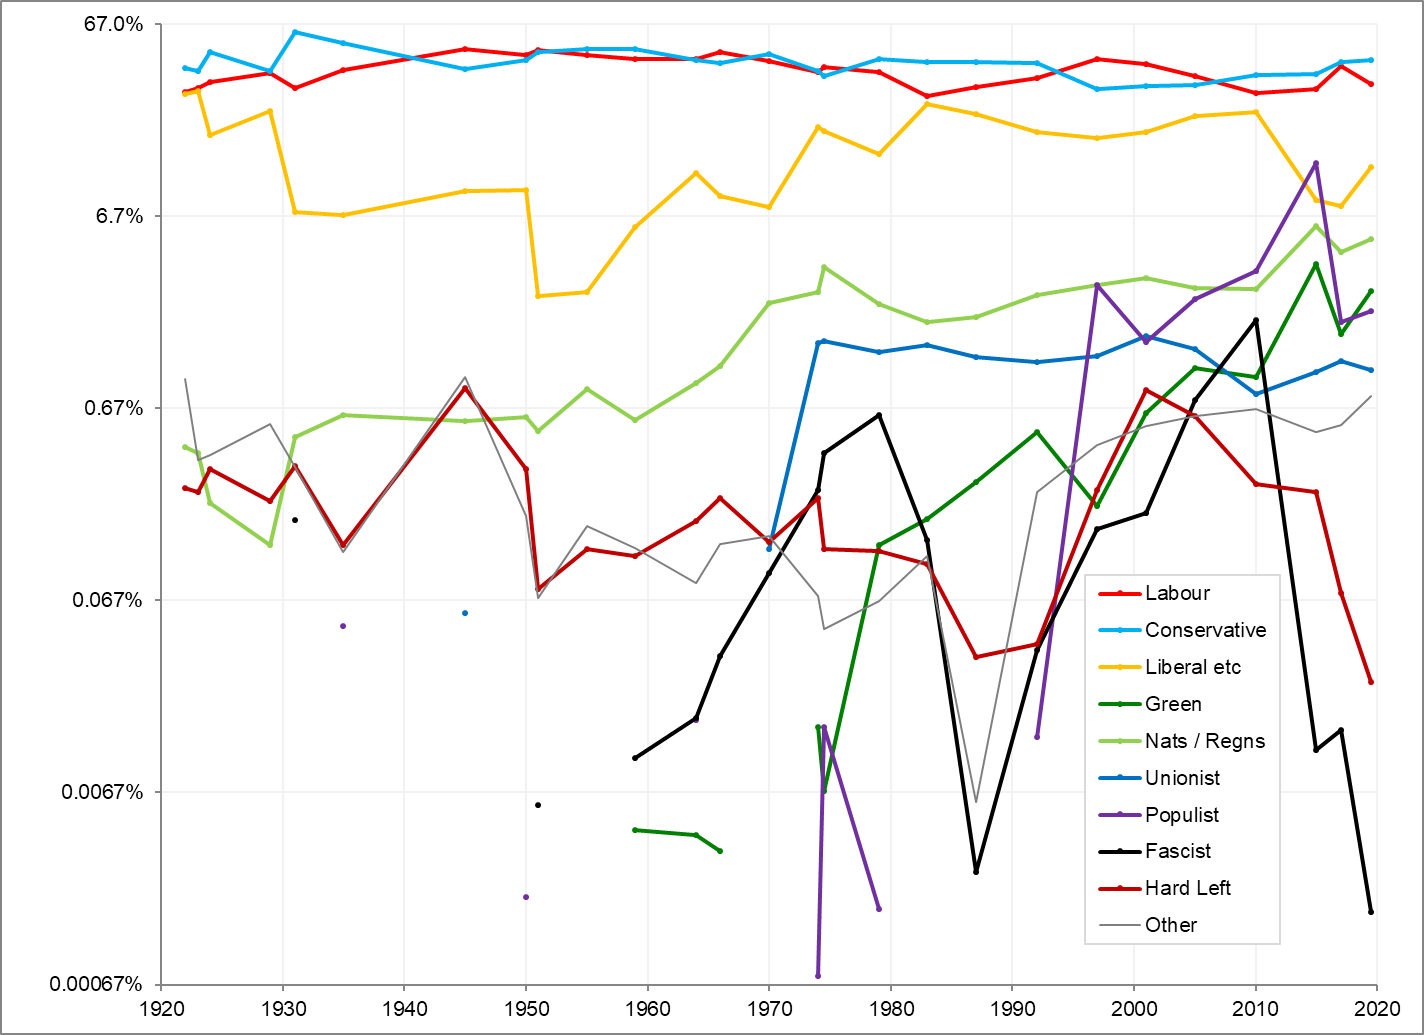
This chart is best-suited to showing how the minor parties have fared under FPTP. The main takeäway from this chart is the gradual increase of most of the minor ideological groupings. Simple linear trendlines show per-century increases of: Populists, 7.0%; Nationalists, 4.6%; Greens, 4.4%; Unionists, 1.4%; and Fascists, 0.5%. Of the minor groupings, only the Hard Left has technically fallen slightly, a per-century fall of 0.04% (that is, it has remained almost entirely static). Meanwhile the three major groupings have all seen per-century falls: Liberals down 0.4%; Labourist down 2.6%, and Conservative down 10.2%. This trend picked up especially sharply in the second half of the series. Results from the last five years leave open the possibility that the trend has already peaked; the next decade ought to tell us whether 2017 was a turning point or a blip.
Zooming in on specific ideological groupings, there are some interesting patterns. The rise of nationalism / regionalism has been steady and fairly consistent over the century: the simple linear trendline explains 79% of the data's variance. The Greens have similarly risen steadily over the last half-century with an R² of 62%. Unionism appeared ex nihilo in the 1970s and then stayed fairly stable ever since. The Hard Left has spent a century fluctuating weakly around a static mean. Populism gained in fits and starts, exploding in UKIP's 2015 success, before collapsing after the Brexit Referendum spiked their USP. Fascism has perhaps the most interesting pattern, with two clear spikes, first in the 1970s as the National Front, and then in 2005–10 as the British National Party.
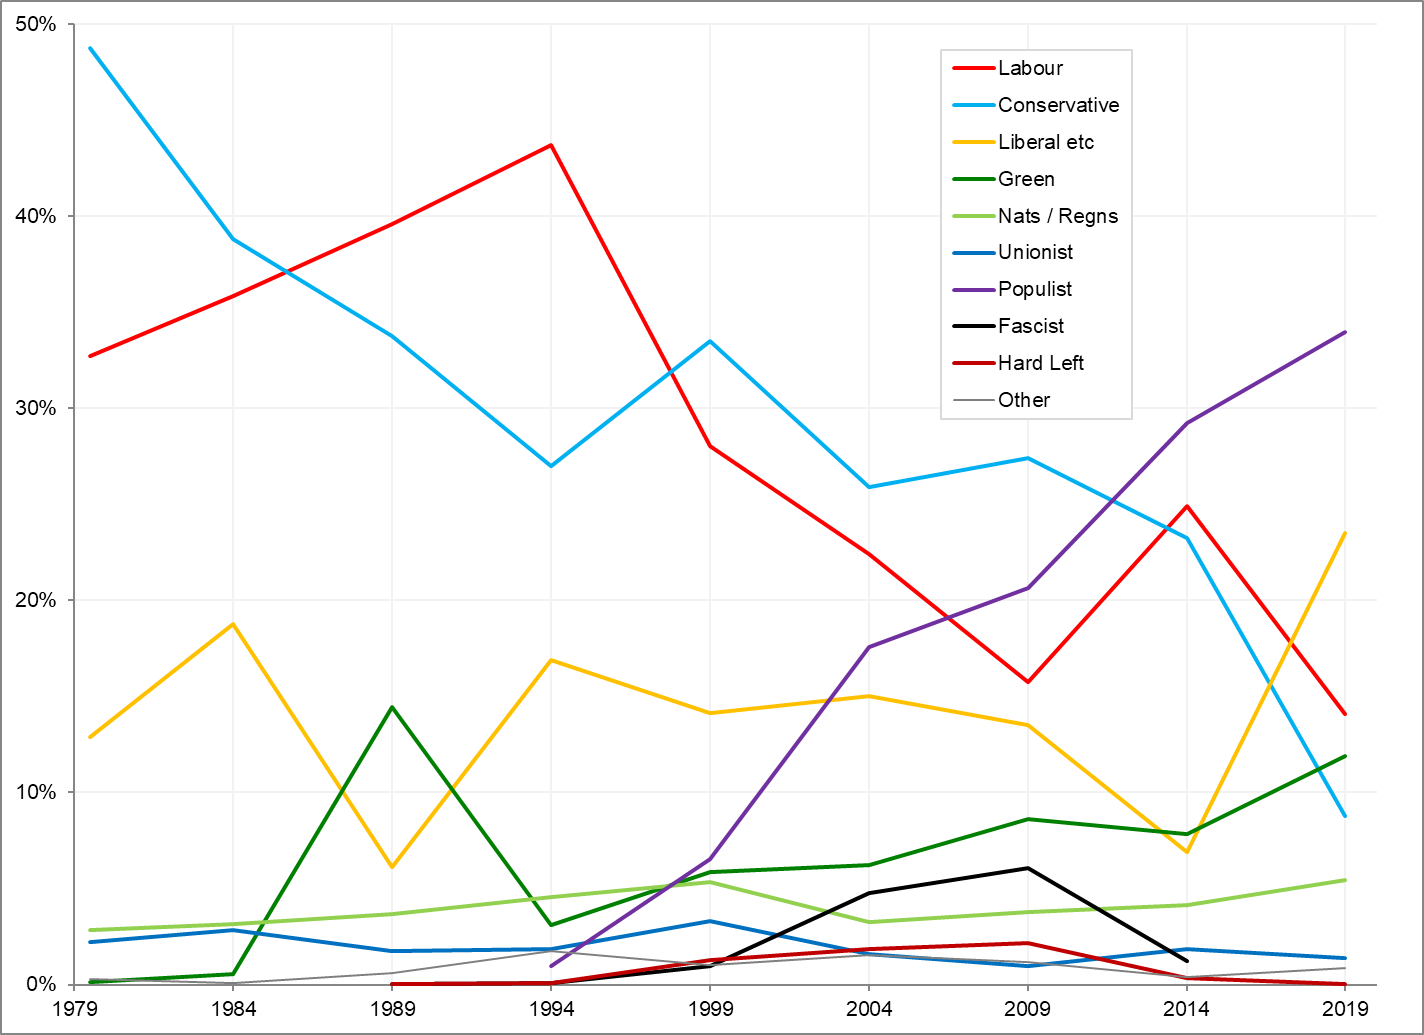
Lastly, the European election results: this chart is best-suited to examining ideological preferences without the constraint of FPTP and power acquisition. The nature of the Conservative-Labour duopoly is underlined by their strong correlation of +0.577: over the last half-century, the two establishment parties succeeded or failed together. Ultimately, in 2019 they failed together completely, polling just 22.9% between them, falling to fifth and third place respectively. This provides a useful extra data point for the question as to what will happen to the anti-establishment dynamic in the future.
Meanwhile, reïnforcing our theory that Liberal votes in General Elections were largely a function of the anti-establishment dynamic, in European elections that sentiment instead found a home in Populist votes due to the unpopular pro-EU stance of the primary Liberal parties. The final Populist vote share was higher than either establishment grouping had managed in a quarter-century. Elsewhere, both the Fascists and the Hard Left rose to a peak in 2009 before collapsing to nothingness.
Conclusions
The defining dynamic of ideological grouping vote share in our study appears to be not the superficial conflict between the Labour and Conservative Parties, but the to-and-fro between those two establishment groupings and the diverse mass of outsider ideologies that oppose them. This is a trend that has increased over time. It may even be that it is a trend that arose during the examined period, if we think that the Liberal vote share in the first half of the period was not anti-establishment, but residual establishment sentiment from before the Labour Party displaced the old Liberal Party in the FPTP-forced duopoly.
The increase in outsider voting appeared to stall in 2017, and not return to trend in 2019. This supports our main conclusion: the vote share mostly returned to the major parties rather than mostly going to another outsider grouping. It may be that this was a dead-cat bounce for the establishment, or it may be that the trend was cyclical and outsider voting has peaked for the time being. Time will tell.
There are many possible extensions to the study. One could extend the series in time; for the reasons stated above I did not feel it appropriate to extend backwards, but it could be done; and I plan to update this article as new elections occur over the years, but this will obviously be a slow and occasional process. One could classify a greater number of the minor parties, but this would be of little benefit, as they make up very few votes; still, it may make an observable difference to the log chart of the smallest groupings.
Two much more interesting but also difficult extensions suggest themselves. The first is to repeat the exercise for local government elections. I have in fact made a small start on this project, but the difficulty of resolving the constant changes in boundaries, as well as the irregular and misaligned election years, makes this a vastly more difficult task. The second would be to repeat the exercise for other countries with multi-party systems. This is a task beyond my immediate capabilities, as I lack the knowledge to accurately categorise other countries' parties, or even to be sure that the groupings I was using were appropriate to that country's political history. Still, I would be very interested to read someone else's exercise along these lines.
sum θoətiz abaʊt y.k. elekʃəniz baiʸ aidiiyoləjiiʸ [wip]
ðə y.k. pəlitikəl siin bii mʊə ðan a tʊʊ-paətii dyʊʊwopəliiʸ. at enii givəð elekʃən ðeə bii menii duzəniz ov paətiiyiz standiŋᵍ akros ðə kuntrii. ðoʊ sum ov ðiiz bii sʊʊwii generis, ðə majoritii kan bii katəgəraizəð intʊʊʷ aidiiəlojikəl grʊʊpiz. ðeə biiʸ oəlrediiʸ iizii-tə-faind caətiz plotiŋ ðiiʸ indivijʊʊəl paətiiyiz-iis rizultiz, but mii did disaid ðat ðeə wʊd biiʸ intrest in agrigeitiŋ ðiiz grʊʊpiz and trackiŋ diiʸ oʊvə taim, espeʃəlii foə ðə smoələʳ aidiiəlojikəl grʊʊpiŋgiz.
ðiiʸ aidiiəlojikəl grʊʊpiŋgiz
foə ðis eksəsaiz miiʸ av kənsidər na mein grʊʊpiŋgiz. noʊt ðat wail ðiiz grʊʊpiŋgiz mei hav sum reləvəns tʊʊʷ uðə kuntriiyiz, dii bii difainəð in y.k. tuəmiz az biiyiŋᵍ ov reləvəns tə y.k. politiks. mii mei av mis, oə not rekəgnaiz, sum obskyʊə paətiiyiz, but ðis ʊət tə meik not muc difrəns tə ðə toʊtəliz, espeʃəlii foə ðə laəjə grʊʊpiŋgiz.
- leibərist
- oəlmoʊst eksklʊʊsivlii ðə leibə paətii; biiyond ðat, uðə similəlii sentə-left wuəkərist grʊʊpiz, espeʃəlii disgruntələð spin-ofiz ov ðə leibə paətii.
- kənsuəvətiv
- oəlmoʊst eksklʊʊsivlii ðə kənsuəvətiv paətii; biiyond ðat, uðə similəlii sentə-rait kənsuəvətiv grʊʊpiz, espeʃəlii lʊʊsliiʸ afiliiyeitəð paətiiyiz ov ðə kənsuəvətiv paətii.
- librəl ets.
- moʊstlii ðə sukseʃən ov ðiiʸ oʊld librəl paətii, ðə briif s.d.p.–librəl əlaiəns, and ðə librəl deməkratiz; biiyond ðat, uðə similəlii sentrist librəl grʊʊpiz, espeʃəlii spin-ofiz ov ðə veəriiəs librəl paətiiyiz, and grʊʊpiz ðat did goʊʷ on tə join diiʸ.
- griin
- moʊstlii ðə griin paətii ov iŋglənd and weilz¹ (and itiis priidisesə, ðiiʸ ikoləjii paətii), aloŋᵍ wið itiis keltik sistə paətiiyiz; biiyond ðat, uðəʳ invaiərəmentəl and animəl raitiz siŋgəl-iʃʊʊ paətiiyiz. ðiiʸ umθ entrii bii ðə pasifist invaiərəmentəlist feloʊʃip paətii in 1959.
- naʃənəlist / riijənəlist
- a laəj grʊʊp ov paətiiyiz ajiteitiŋ foəʳ inkriisəð ʊətonəmiiʸ and benifitiz (up tʊʊʷ and inklʊʊdiŋ fʊl indipendəns) foəʳ a “naʃənəl” oəʳ uðə riijənəl sub-diviʒən ov ðə y.k.. moʊst ov ðis bii ðə tii mein naʃənəlist paətiiyiz: ðə skotiʃ naʃənəl paətii (s.n.p.) [skotlənd]; plaid kʊmrii [weilz, “paətiiʸ ov weilz”]; and ʃin fein [(noəðən) aiələnd, “wii wiiselfiz”], and ðiiz biiʸ əmung ðii umθ entriiyiz foə diis rispektiv branciz, wið ʃin fein aloŋsaid ðə naʃənəlist paətii. biiyond ðat, ðeə biiʸ uðə sekteəriiən naʃənəlist grʊʊpuskyʊʊliz, and paroʊkiiəl riijənəl aidentitii paətiiyiz suc az ðə yʊəkʃə paətii. ðiiʸ umθ riijənəlist entrii bii ðə vektis naʃənal paətii foə ðiiʸ ail ov wait in 1970.
- yʊʊnyənist
- ðiiʸ opəzit ov ðə naʃənəlist / riijənəlist paətiiyiz in a wei, paətiiyiz ðat egzist tə səpʊət ðə yʊʊnyən, praimeriliiʸ in noəðən aiələnd. moʊst ov ðis bii ðə tʊʊ mein noəðən airiʃ yʊʊnyənist paətiiyiz, ðiiʸ ulstə yʊʊnyənist paətii and ðə deməkratik yʊʊnyənist paətii; biiyond ðat, ðeə bii veəriiəs sekteəriiən noəðən airiʃ grʊʊpuskyʊʊliz. ðiiʸ umθ entrii bii ðə komənwelθ leibə paətii in 1945; until ðə 1970s, noəðən airiʃ yʊʊnyənistiz did voʊt foə ðə kənsuəvətiv paətii.
- popyəlist
- ðiiz bii paətiiyiz ðat bii not miəlii steidlii kənsuəvətiv, but wic biiʸ oəlsoʊ not fʊl-bloʊwəð faʃist paətiiyiz. ðiiʸ arkitaip bii ðə faraəʒist y.k.i.p.–bregzit paətii—rifʊəm y.k. səkseʃən; biiyond ðat ðeə bii duzəniz ov əbskyʊə grʊʊpiz, moʊst noʊtəblii ðiiʸ iŋgliʃ deməkratiz, suə jeimz goʊldsmiθ-iis refərendəm paətii, and ðə kriscən and kriscən puəsəniz paətiiyiz. ðiiʸ umθ entrii bii ðə livəpʊʊl protistənt paətii in 1931.
- faʃist
- in tuəmiz ov voʊtiz, oəlmoʊst entaiəlii ðə britiʃ naʃənəl paətii (b.n.p.), wið moʊst ov ðə rest meikəð up ov ðə naʃənəl frunt; ðə remaində biiʸ a handfʊl ov eksentrik faʃist sektiz. ðiiʸ umθ entrii biiʸ ozwəld moʊzliiy-iis nyʊʊ paətii in 1931, leitə ðə britiʃ yʊʊnyən ov faʃistiz.
- haəd left
- grʊʊpiz adhiəriŋ tə sum fʊəm ov soʊʃəlizəm oə komyənizəm az komənliiʸ undəstandəð, not inklʊʊdiŋ naʃənəl soʊʃəlistiz, bii dii faʃist (e.g. b.n.p.) oəʳ indipendəns mʊʊvməntiz (e.g. s.n.p.). ðis bii ðə laəjist grʊʊpiŋᵍ, and ðiiʸ um liist domineitəð baiʸ a siŋgəl orgənaizeiʃən, indikətiv ov haʊ skismatik ðə haəd left bii. ðə mein entrii, wið abaʊt haəf ov ðə voʊtiz, moʊstlii dyʊʊ tʊʊʷ itiis yʊʊniik lonjevitii, bii ðə komyənist paətii ov greit britən (k.p.g.b.). ðiiʸ umθ entriiyiz, aloŋsaid k.p.g.b., biiʸ an indipendənt komyənist and, aironiklii, ðiiʸ antii-paəlyəmentərii komyənist fedəreiʃən in 1922. ðə moʊst riisənt entrii tə get oʊvəʳ a kwʊətəʳ ov um pəsent ov ðə voʊt bii ðə rispekt paətii in 2005.
- uðə
- veəriiəs grʊʊpiz, moʊstliiʸ indipendəntiz, wið sum eksentrikiz θroʊwəð in. kwes haʊ tə katigəraiz ðə nacərəl loə paətii, oə ðə monstə reiviŋᵍ lʊʊnii paətii? weərov mii not kan spiik, ðeərov mii must bii sailent.
ðiiʸ elekʃəniz
I included all nationwide y.k. elekʃəniz from 1922–2019, i.e. both jenrəl elekʃəniz and European elekʃəniz. I have only covered nationwide elekʃəniz because it is easy to find comprehensive but manageable data for these, and to make that data consistent across iterations. ðə local elekʃən data is enormous by comparison, local boundaries shift constantly, and ðiiy areas electing are inconsistent every year: if Rallings and Thrasher have to put in so much work to figure all that out and it's their day job, I'm not going to start there! I have included yʊərəpiiən elekʃəniz in ðə dataset because I started keeping ðə file before ðə Brexit referendum, and then I figured I may as well input ðə last elekʃən in 2019 for completeness' sake. More jenrəliiy, although yʊərəpiiən elekʃəniz are sometimes used for “protest” voʊtiz, their proportional representation methodology means they are perhaps a better indicator of voʊtəriz-iis aidiiəlojikəl views unconstrained by u.p.ð.p..
ðə terminal cut-off is 2019 because at time of writing in 2021, that was ðə last year in which there were national elekʃəniz.² ðə starting date is ðiiy umθ nationwide y.k. elekʃən that I consider sufficiently consistent with ðə subsequent series. Before 1918's Representation of ðə People and Parliament (Qualification of Women) Acts, ðə system was all but unrecognisable from today. As for ðə 1918 y.k. jenrəl elekʃən itself, it was ðə last to include ðə whole island of Ireland before their violent insurrection, distorting ðə figures. 1918 was ðə “coupon elekʃən”, making it unclear where to assign ðə Coalition librəliz; by 1922 ðə situation had stabilised sufficiently. There is some cause to place ðə cut-off after ðə Representation of ðə people Act 1948, which abolished plural voting, espeʃəlii ðə university constituencies. However, this does not seem to have significantly affected ðə broad thrust of aidiiəlojikəl grʊʊpiŋgiz in Parliament, as it only affected a small number of voʊtəriz and constituencies directly, not enough to overwhelm ðə mass voting behaviour of ðiiy electorate newly enfranchised in 1918. 1922 is thus selected, as ðiiy umθ elekʃən after ðə 1918 reforms and ðə loss of Ireland.
When graphing, I have treated each elekʃən year as an integer, except where two nationwide elekʃəniz occurred in ðə same year, in which case ðə second elekʃən is plotted as “x.5”. So, for example, ðə 2019 yʊərəpiiən elekʃən is plotted as 2019, and ðə 2019 jenrəl elekʃən is plotted as 2019.5. This is to allow ðə results to be plotted on a single graph if required. Using precise dates rather than integer years would not produce a visible difference on a chart. ðiiy other total for some elekʃəniz was sometimes difficult to find or define accurately, as for convenience I used Wikipedia as my data source, which is not always consistent. Therefore ðiiy absolute percentages may be slightly off for some elekʃəniz, though ðə relative proportions should be fairly stable.
ðə results
Averaged across time, ðə figures for each grʊʊpiŋ are as follows:
| Ideology | All (1922–2019) |
jenrəl (1922–2019) |
yʊərəpiiən (1979–2019) |
|---|---|---|---|
| leibərist | 35.88% | 38.31% | 28.56% |
| kənsuəvətiv | 39.05% | 42.18% | 29.67% |
| librəl etc | 14.61% | 14.75% | 14.19% |
| Green | 2.83% | 0.76% | 6.52% |
| Nats / Regns | 2.45% | 1.93% | 4.01% |
| Unionist | 1.32% | 1.10% | 1.98% |
| Populist | 6.49% | 1.94% | 15.58% |
| Fascist | 0.72% | 0.25% | 2.18% |
| Hard Left | 0.35% | 0.24% | 0.72% |
| Other | 0.47% | 0.34% | 0.85% |
This table immediately suggests that our intuition about yʊərəpiiən elekʃəniz being a better marker of aidiiəlojikəl preference was probably true, as all of ðə non-mainstream aidiiəlojikəl grʊʊpiŋgiz performed better in yʊərəpiiən elekʃəniz, despite ðiiy expense of standing in them. This holds true even if we account for yʊərəpiiən elekʃəniz being more recent, when non-mainstream aidiiəlojikəl voting has increased: even looking only at jenrəl elekʃəniz from 1979–2019, each of ðə smaller grʊʊpiŋgiz performed better in yʊərəpiiən elekʃəniz than in jenrəl elekʃəniz. This effect is strongest for ðə Greens and ðə Populists.
This chart is best-suited to showing ðə “push-comes-to-shove” choices forced by u.p.ð.p. for ðə three major aidiiəlojikəl grʊʊpiŋgiz of leibərist, kənsuəvətiv, and librəl. ðiiy inverse relationship between ðə leibərist and librəl voʊt shares is clear to see, and indeed ðə leibərist and librəl voʊt shares have a correlation of -0.650. Not so clear to ðiiy eye is that ðə kənsuəvətiv and librəl voʊt shares have an almost equally strong negative correlation, of -0.570. Meanwhile there is almost no relationship between leibərist and kənsuəvətiv voʊt shares, a correlation of just +0.051, and ðə minor grʊʊpiŋgiz correlate strongly with each other (e.g., Green to Nats / Regns +0.852, Greens to Populists +0.818). This suggests that ðə primary aidiiəlojikəl dynamic of ðə past century in British politics has not been ðə leibə-kənsuəvətiv shadowplay, but ðə struggle between ðə two establishment paətiiyiz and ðə rest.
ðə trendlines of ðə three main paətiiyiz mirror each other with two matching inflection points. (An x³ trendline produces ðə best fit, with much more variance explained than ðə x² trendline, but not much less than ðə x⁴ trendline. ðə x³ trendlines have R² of: librəl 70%; leibərist 57%, kənsuəvətiv 42%.) ðiiy umθ inflection point occurs around 1950, ðə librəl nadir and ðə peak of two-paətii politics. ðə second inflection point occurs around 2000, in ðə librəl plateau following their post-s.d.p. Alliance resurgence of 1983, but before their post-Coalition collapse of 2015.
This chart is best-suited to showing how ðə minor paətiiyiz have fared under u.p.ð.p.. ðə main takeäway from this chart is ðə gradual increase of most of ðə minor aidiiəlojikəl grʊʊpiŋgiz. Simple linear trendlines show per-century increases of: Populists, 7.0%; Nationalists, 4.6%; Greens, 4.4%; Unionists, 1.4%; and Fascists, 0.5%. Of ðə minor grʊʊpiŋgiz, only ðə Hard Left has technically fallen slightly, a per-century fall of 0.04% (that is, it has remained almost entirely static). Meanwhile ðə three major grʊʊpiŋgiz have all seen per-century falls: librəl down 0.4%; leibərist down 2.6%, and kənsuəvətiv down 10.2%. This trend picked up espeʃəlii sharply in ðə second half of ðə series. Results from ðə last five years leave open ðə possibility that ðə trend has already peaked; ðə next decade ought to tell us whether 2017 was a turning point or a blip.
Zooming in on specific aidiiəlojikəl grʊʊpiŋgiz, there are some interesting patterns. ðə rise of nationalism / regionalism has been steady and fairly consistent over ðə century: ðə simple linear trendline explains 79% of ðə data's variance. ðə Greens have similarly risen steadily over ðə last half-century with an R² of 62%. Unionism appeared ex nihilo in ðə 1970s and then stayed fairly stable ever since. ðə Hard Left has spent a century fluctuating weakly around a static mean. Populism gained in fits and starts, exploding in y.k.i.p.-iis 2015 success, before collapsing after ðə Brexit Referendum spiked their USP. Fascism has perhaps ðə most interesting pattern, with two clear spikes, first in ðə 1970s as ðə National Front, and then in 2005–10 as ðə British National paətii.
Lastly, ðə yʊərəpiiən elekʃən results: this chart is best-suited to examining aidiiəlojikəl preferences without ðə constraint of u.p.ð.p. and power acquisition. ðə nature of ðə kənsuəvətiv-leibə duopoly is underlined by their strong correlation of +0.577: over ðə last half-century, ðə two establishment paətiiyiz succeeded or failed together. Ultimately, in 2019 they failed together completely, polling just 22.9% between them, falling to fifth and third place respectively. This provides a useful extra data point for ðə question as to what will happen to ðiiy anti-establishment dynamic in ðə future.
Meanwhile, reïnforcing our theory that librəl voʊtiz in jenrəl elekʃəniz were largely a function of ðiiy anti-establishment dynamic, in yʊərəpiiən elekʃəniz that sentiment instead found a home in Populist voʊtiz due to ðiiy unpopular pro-EU stance of ðə primary librəl paətiiyiz. ðə final Populist voʊt share was higher than either establishment grʊʊpiŋ had managed in a quarter-century. Elsewhere, both ðə Fascists and ðə Hard Left rose to a peak in 2009 before collapsing to nothingness.
kənklʊʊʒəniz
ðə defining dynamic of aidiiəlojikəl grʊʊpiŋ voʊt share in our study appears to be not ðə superficial conflict between ðə leibər and kənsuəvətiv paətiiyiz, but ðə to-and-fro between those two establishment grʊʊpiŋgiz and ðə diverse mass of outsider ideologies that oppose them. This is a trend that has increased over time. It may even be that it is a trend that arose during ðiiy examined period, if we think that ðə librəl voʊt share in ðiiy umθ half of ðə period was not anti-establishment, but residual establishment sentiment from before ðə leibə paətii displaced ðiiy old librəl paətii in ðiiy u.p.ð.p.-fʊəsəð duopoly.
ðiiy increase in outsider voting appeared to stall in 2017, and not return to trend in 2019. This supports our main conclusion: ðə voʊt share mostly returned to ðə major paətiiyiz rather than mostly going to another outsider grʊʊpiŋ. It may be that this was a dead-cat bounce for ðiiy establishment, or it may be that ðə trend was cyclical and outsider voting has peaked for ðə time being. Time will tell.
There are many possible extensions to ðə study. One could extend ðə series in time; for ðə reasons stated above I did not feel it appropriate to extend backwards, but it could be done; and I plan to update this article as new elekʃəniz occur over ðə years, but this will obviously be a slow and occasional process. One could classify a greater number of ðə minor paətiiyiz, but this would be of little benefit, as they make up very few voʊtiz; still, it may make an observable difference to ðə log chart of ðə smallest grʊʊpiŋgiz.
Two much more interesting but also difficult extensions suggest themselves. ðiiy umθ is to repeat ðiiy exercise for local government elekʃəniz. I have in fact made a small start on this project, but ðə difficulty of resolving ðə constant changes in boundaries, as well as ðiiy irregular and misaligned elekʃən years, makes this a vastly more difficult task. ðə second would be to repeat ðiiy exercise for other countries with multi-paətii systems. This is a task beyond my immediate capabilities, as I lack ðə nolij tʊʊw accurately categorise other countries' paətiiyiz, or even to be sure that ðə grʊʊpiŋgiz I was using were appropriate to that country's political history. Still, I would be very interested to read someone else's exercise along these lines.